Core Web Vitals: LCP, CLS and INP from real visits
On this page
The Web Vitals strip shows how fast your pages feel to real visitors: how quickly they load, how steady the layout stays and how fast they answer a tap. It uses the three Core Web Vitals that Google uses, measured by your own analytics tag.
Where to find Web Vitals#
Open Analytics and scroll past the Geography and Technology cards. The Web Vitals strip appears once your own tag has reported in the last 30 days.
Pages Quillly serves don't send Web Vitals, so a site measured only through them never shows the strip. Install analytics on your website adds the tag to your own pages.
What the Web Vitals numbers mean#
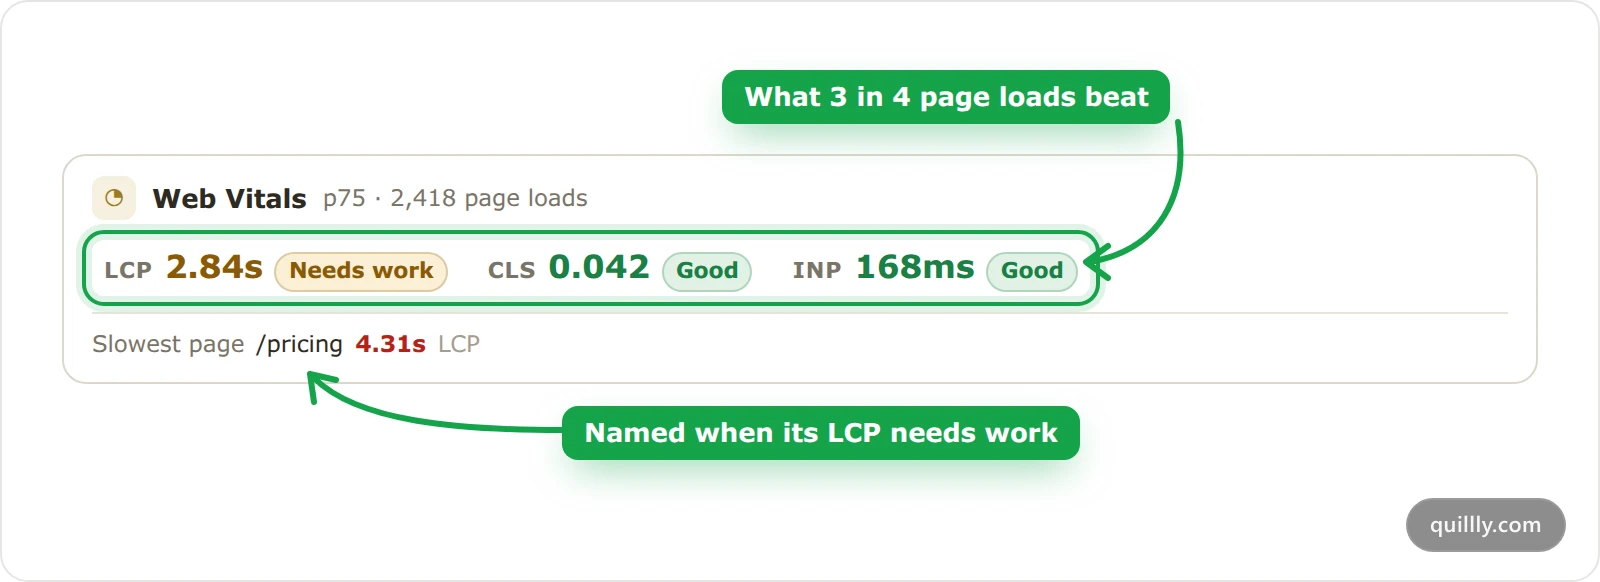
Each number is the 75th percentile, marked p75: three in four page loads in the range were as good or better. The count beside it, such as p75 · 2,418 page loads, is how many page loads sent a measurement.
Metric | What it measures | Good | Poor |
|---|---|---|---|
LCP | Time until the main content appears | 2.5 s or less | Over 4 s |
CLS | How much the layout jumps while loading | 0.1 or less | Over 0.25 |
INP | Delay before the page answers a tap or click | 200 ms or less | Over 500 ms |
Anything between the two limits is rated Needs work. Hover a metric to see what it measures. Google's guide to Web Vitals explains each metric and why these limits were chosen.
The slowest page#
Under the three numbers, the strip names the page with the worst p75 LCP, such as Slowest page /pricing 4.31s LCP. It appears only when that page's LCP isn't rated Good, so a fast site shows no line at all.
How the tag measures Core Web Vitals#
One sample per page load. The tag sends it when the visitor hides or leaves the page. In a single-page app, moving between routes doesn't send a new sample.
LCP is the time until the largest element on the page is painted.
CLS adds up every layout shift the visitor didn't cause, over the whole visit. On long visits it can read higher than Google's figure, which keeps only the worst burst of shifts.
INP is the slowest interaction that took 40 ms or more. A page load where every tap was faster sends no INP value.
Browsers that can't measure a metric send nothing for it, and paths you exclude with
data-qa-excludesend no samples.
When a number needs work#
The strip tells you which metric to look at, and the slowest page tells you where to start. Common fixes:
LCP: make the main image or heading load first. Compress large images, and avoid loading them late with JavaScript. Google's guide to LCP goes deeper.
CLS: give images, videos and embeds a width and height, and reserve space for anything that loads late, such as banners.
INP: keep the page's JavaScript light during taps and clicks, and split long tasks into smaller ones.
After a fix, compare the next weeks with the weeks before. The numbers move only as new visitors load the changed page.
Note
Web Vitals come from real visits, so a page needs visitors before it has numbers. A new page, or a range with little traffic, can show a quiet strip for a while.
Common questions#
Why don't my numbers match PageSpeed Insights?#
PageSpeed Insights reports Google's data from Chrome users over the past 28 days, next to a lab test. Quillly measures your own visitors in the range you pick and adds up CLS over the whole visit, so the two can differ.
Why is the Web Vitals strip missing?#
It shows only when your own tag has reported in the last 30 days. Pages Quillly serves don't send Web Vitals, so check that the tag is on the pages you host yourself.
Can my AI assistant read Web Vitals?#
Not yet. The get_website_analytics tool doesn't include Web Vitals, so your assistant can't see them. Read them on the Analytics page, and paste the numbers into the chat when you want its help.
Related#
Read the Analytics dashboard: the rest of the numbers on the page.
Install analytics on your website: the tag that measures Web Vitals.
Analytics limits, retention and excluding traffic:
data-qa-excludeand how long data is kept.