Read the Analytics dashboard
On this page
- Pick a date range
- The headline numbers
- How visits and the bounce rate are counted
- Read the chart
- Open one day's detail
- See which pages people read
- Traffic sources and channels
- Tag your links with UTM parameters
- Countries and devices
- Further down the analytics dashboard
- Common questions
- Why does my bounce rate look high?
- Why don't my numbers match Google Analytics?
- Why is there no AI answers tile?
- Related
The Analytics dashboard shows who visits your site, where they come from and what they read. This page walks through the analytics dashboard from top to bottom, so you know what each number counts and where to click next.
Numbers appear once your site reports: through the tag you install on your site, or from the pages Quillly serves for you.
Pick a date range#
The range button sits in the page header. Open it to pick Today, Yesterday, 24 hours, 7 days, Week to date, Month to date, 30 days, 90 days or Custom range…. While the menu is open, each option's letter works as a shortcut, such as T for Today.
‹ and › step back and forward by one period of the same length.
Daily or Weekly sets the chart's buckets. Weekly needs a range of 14 days or more.
The refresh button reloads the numbers. The page also refreshes itself every minute while you look at it.
Every day on the analytics dashboard is a UTC day, so a day starts at midnight UTC wherever you are.
The headline numbers#
Number | What it counts |
|---|---|
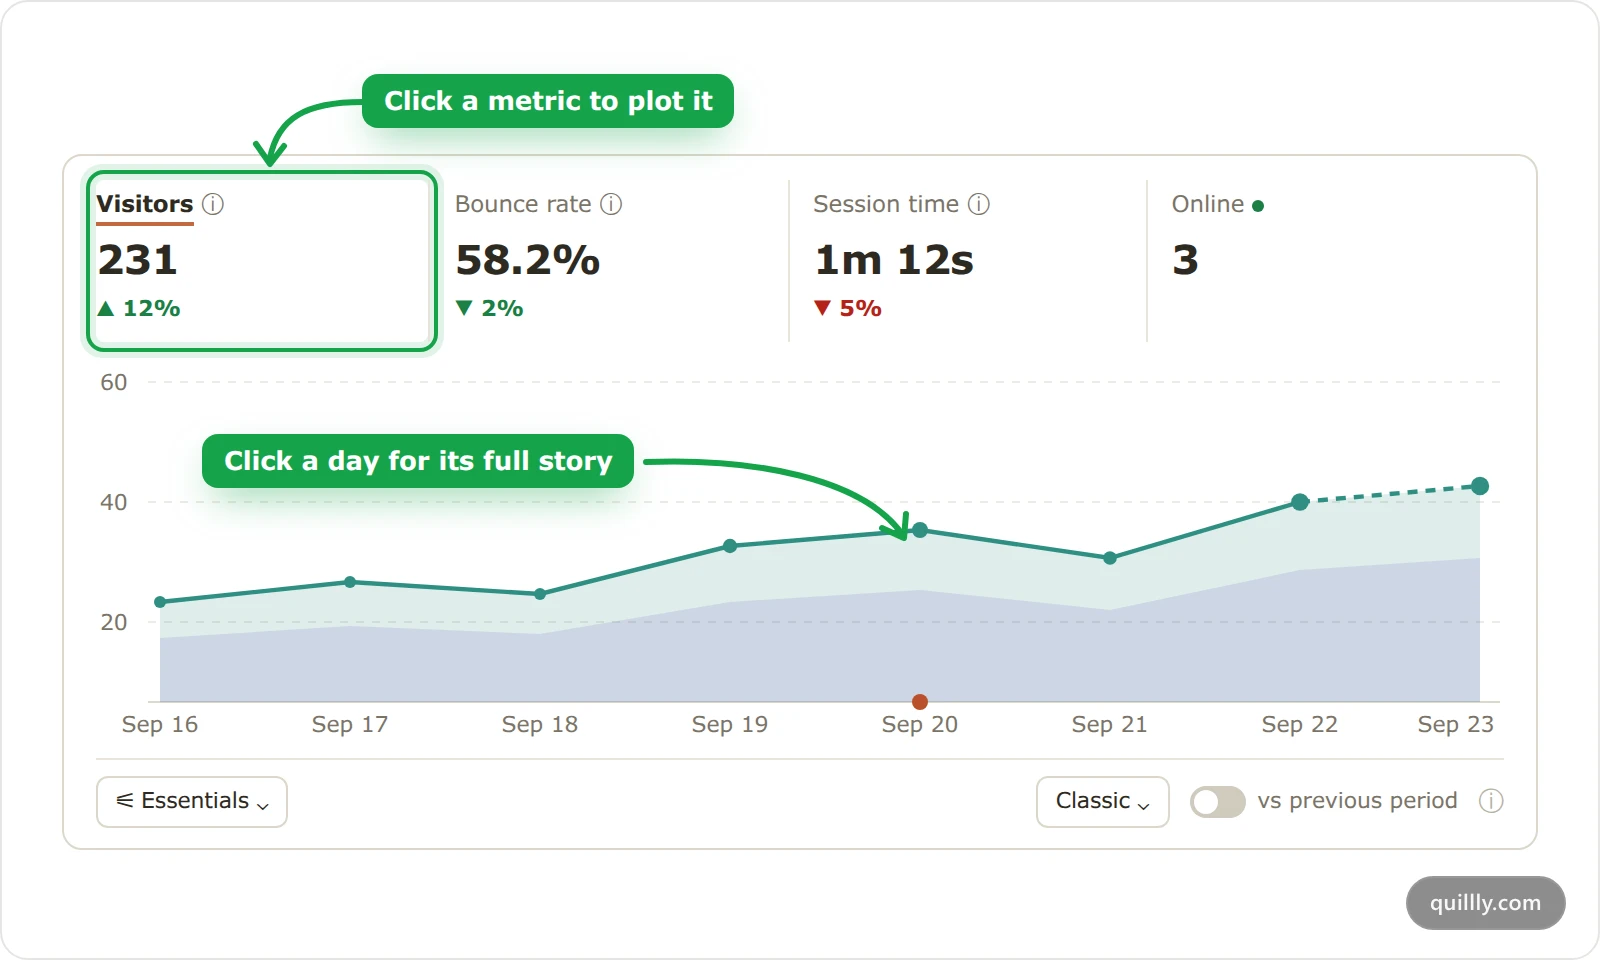
Visitors | Unique people in the range, each counted once. Hover a day on the chart for its page views and new versus returning visitors. |
AI answers | Times an AI assistant fetched one of your pages to answer someone. It shows only when there are some. |
Search clicks and Search impressions | Clicks and appearances in the search engines you've connected. |
Bounce rate | The share of visits with no interaction. Lower is better. |
Session time | The average time a visit stayed active. |
Online | Visitors active in the last 5 minutes. Click it to see them on the globe. |
Domain Rating | Your domain's Ahrefs Domain Rating, when Quillly has a history for it. |
Each tile compares the range with the period of the same length right before it. The picker under the chart chooses which tiles show: Essentials, SEO focus, Engagement or Everything.
How visits and the bounce rate are counted#
A visit lasts as long as the browser tab stays open. Opening your site in a new tab starts a new visit, and there's no 30-minute timeout.
Visitors are distinct people with a visit in the range. How Quillly recognises someone who returns depends on the cookie or cookieless mode.
Bounce rate counts visits with no interaction. On pages Quillly serves, scrolling, clicking a link or copying code counts. On your own pages, the tag sends page views and time on page but no clicks or scrolls, so a visit there stops being a bounce only when it completes a goal.
Session time comes from the time on page the tag reports. A visit without that measurement uses the time between its first and last event, up to 30 minutes.
Read the chart#
Click a tile to plot it on the chart. To compare, hold ⌘ or Ctrl, or Shift, and click more tiles, up to four at once.
Visitors on its own splits into two bands: returning visitors below, and new visitors stacked on top.
A dot on the date axis marks a day you published a post. A small ringed disc on the curve marks that day's top traffic source.
A dashed last segment means the current day or week isn't over yet.
Chart style switches between Classic and Dither, and vs previous period draws the previous period behind the current one.
The About this chart button in the corner explains the scales and markers on your screen. Below the chart, the Search Performance card breaks down your search traffic, as Search performance and the Focus list describes.
Open one day's detail#
Click a day on the chart to open everything that happened that day. The panel lists what you published, then Traffic: Visitors, Sessions, Page Views, Bounce Rate and Session Time, each compared with the day before. Search, Top pages, traffic sources and AI crawls follow.
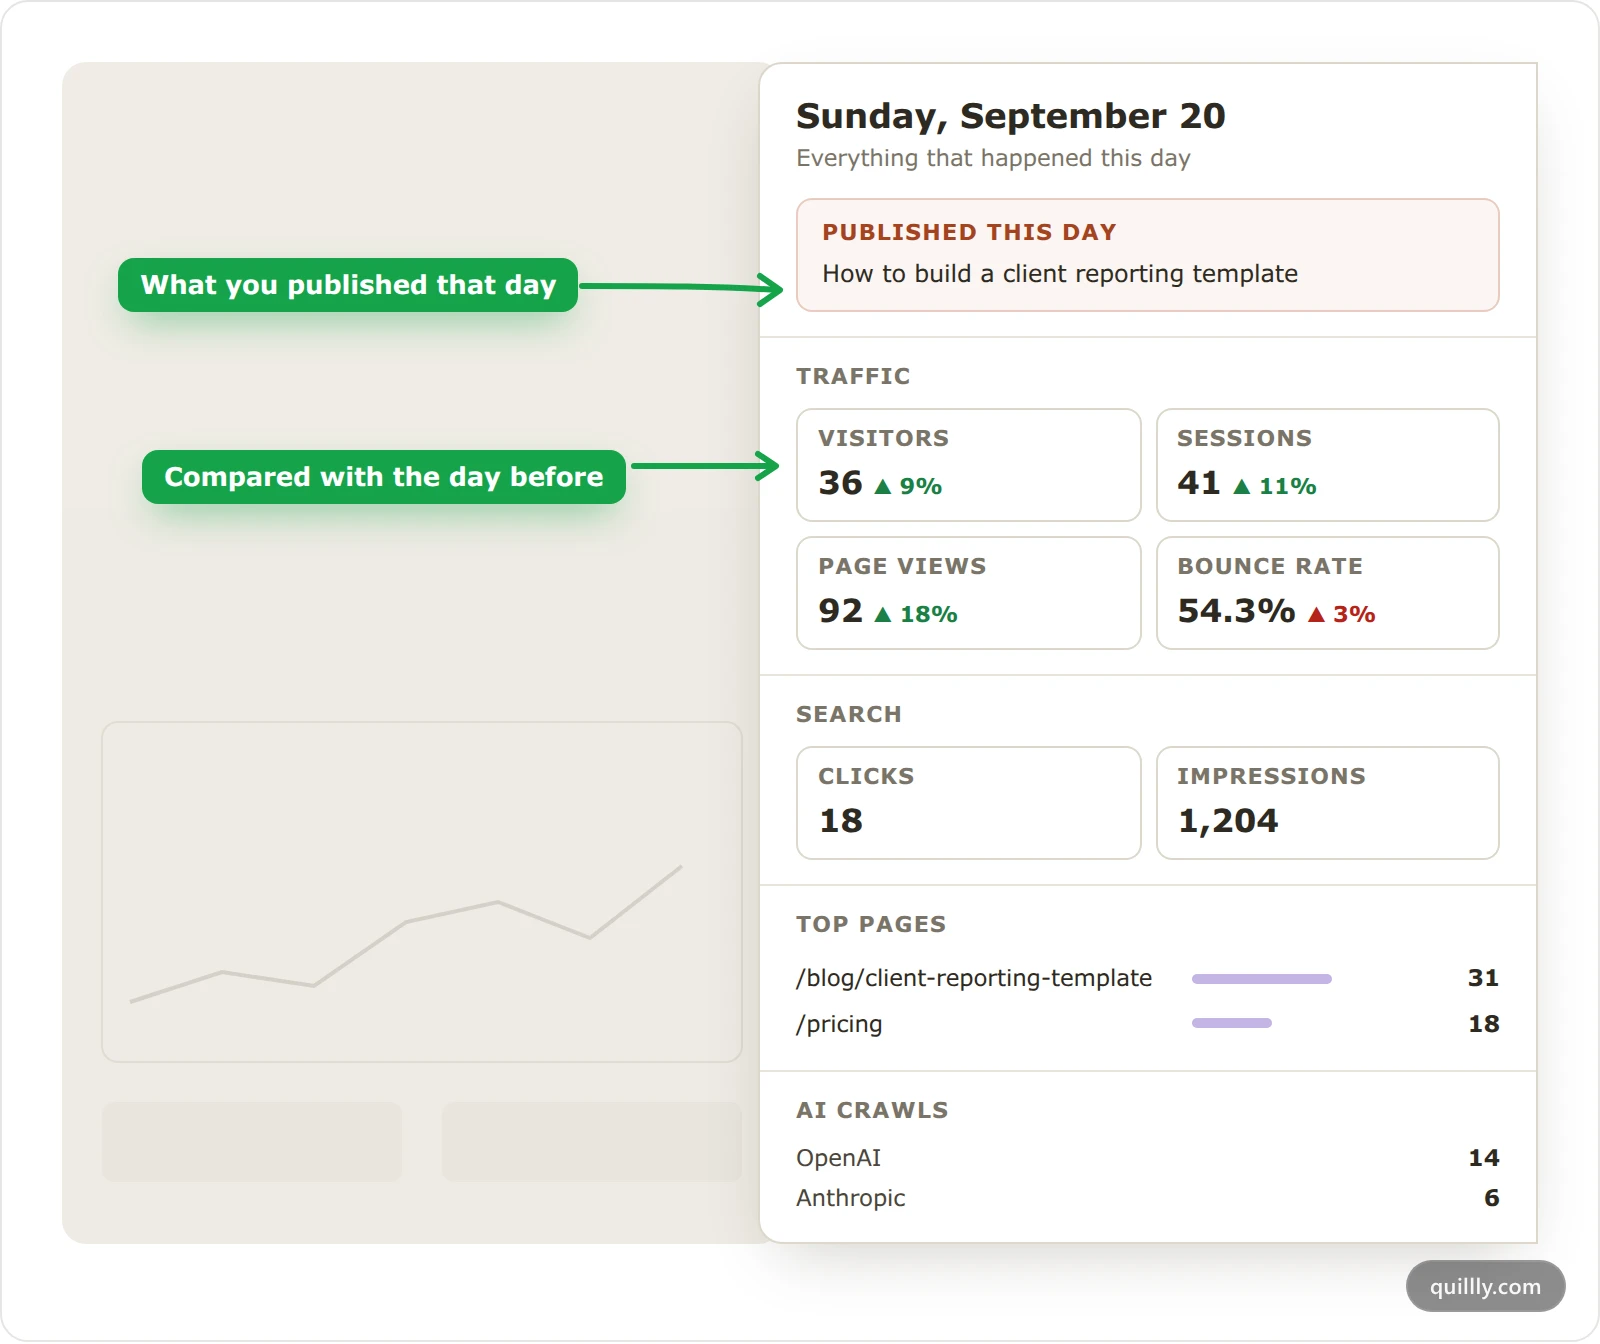
A day with nothing notable says A quiet day — no standout activity. On ranges of two days or less, the chart shows hours instead of days.
See which pages people read#
The Pages card ranks your pages by visitors. Its tabs show the Page, the Entry Page where visits start and the Exit Page where they end. Switch the card from Visitors to Crawls to rank pages by how often crawlers fetched them instead.
Pages Quillly publishes for you show their content type and SEO score beside the path. Hover or click a page to see how many visits it starts and ends, and, for articles Quillly serves, how far people scroll.
Traffic sources and channels#
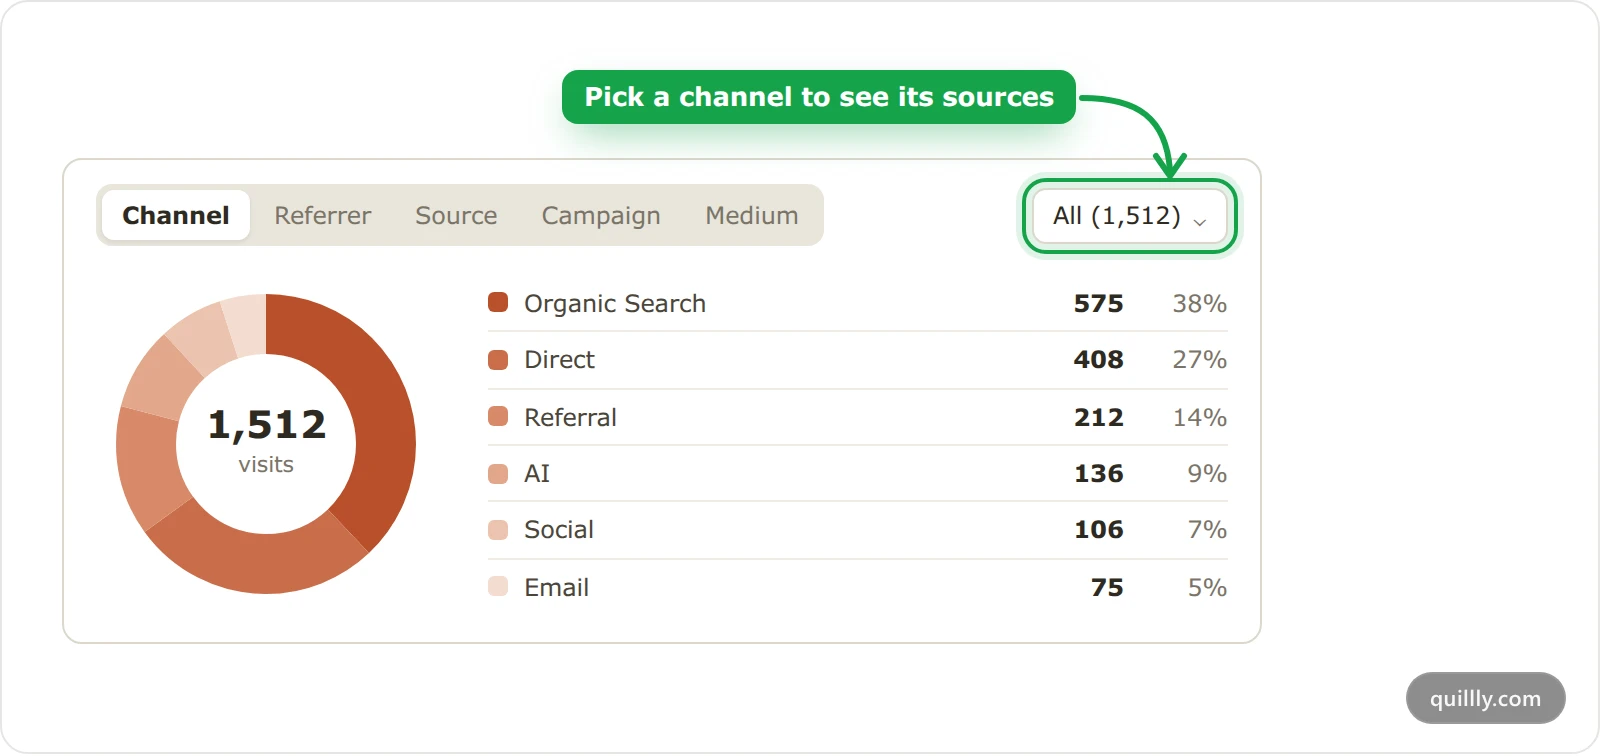
The Traffic Sources card opens on Channel, a donut of the kinds of traffic you get. Pick a channel from the menu above the donut to see the sources inside it.
Channel | What puts a visit there |
|---|---|
AI | A link from an AI assistant's site, such as chatgpt.com, claude.ai, perplexity.ai, gemini.google.com or copilot.microsoft.com |
Organic Search | Google, Bing, DuckDuckGo, Ecosia or Yandex, or a UTM medium of |
Social | X, LinkedIn, Facebook, Reddit, YouTube, Instagram or Hacker News, or a UTM medium of |
Referral | Any other website, or a UTM medium of |
A UTM medium of | |
Paid Search | A UTM medium of |
Direct | No referring site and no UTM medium, or a UTM medium Quillly doesn't know |
The other tabs appear when they have data. Referrer lists the sites that linked to you. Source shows the same visits by source name, and a utm_source tag replaces the referring site there. Campaign lists your utm_campaign values, and Medium your mediums. Keyword lists the Google searches that brought clicks, when Search Console is connected.
Tag your links with UTM parameters#
Quillly reads three UTM parameters from the page address: utm_source, utm_medium and utm_campaign. It ignores utm_term and utm_content.
https://acme.com/pricing?utm_source=newsletter&utm_medium=email&utm_campaign=octoberA visit from that link shows newsletter under Source, Email under Channel and october under Campaign. Google's Campaign URL Builder builds tagged links, and Google's guide to UTM parameters explains each one.
Tip
Write utm_medium in lowercase, as email, social, referral, organic, cpc, ppc or paid. Quillly matches these exactly and files any other medium under Direct.
Countries and devices#
The Geography card shows visitors on a Globe, with a live activity feed when you expand it, and ranks them by Countries. The tag you paste records the country only, so Regions and Cities appear when pages Quillly serves supply them. The Technology card splits visitors by Browser, OS and Device.
Further down the analytics dashboard#
Web Vitals, a strip with your pages' loading speed, once your own tag reports. See Core Web Vitals.
The visitors card, with Goal, Funnel, Users and Journey tabs. See goals, funnels and visitor journeys.
AI & crawlers, the crawler visits Quillly detects on the pages it serves. See AI traffic: answers, visits and crawlers.
Common questions#
Why does my bounce rate look high?#
On your own pages, the tag records page views but not clicks or scrolls, so only a completed goal marks a visit as engaged. Add goals for the actions that matter, and the bounce rate starts to reflect them.
Why don't my numbers match Google Analytics?#
Each tool defines visits differently. Quillly keeps a visit open for as long as the tab stays open, drops known bots and counts days in UTC, so totals differ from tools with other rules.
Why is there no AI answers tile?#
The tile appears only when an AI assistant fetched one of the pages Quillly serves for you in the range. The tag on your own pages can't see those fetches, so a site measured only by the tag never shows it.
Related#
Install analytics on your website: add the tag so your own pages report.
Track goals and conversions: count signups and purchases.
AI traffic: answers, visits and crawlers: the AI channel and crawler traffic in detail.
Search performance and the Focus list: clicks, impressions and keywords from search engines.
AI crawlers, llms.txt and Markdown pages: how AI assistants read the pages Quillly serves.